WUNRN
EUROPEAN PARLIAMENTARY RESEARCH SERVICE – GRAPHICS & DATA RESOURCES
http://epthinktank.eu/2015/08/17/eprs-graphic-warehouse-when-a-picture-tells/
WUNRN requests gender disaggregation for this chart. Some of the EPRS visuals do give female/male differentiation.
The EPRS Graphics Warehouse
(European Parliamentary Graphics Warehouse) collects all visuals from EPRS
publications, and categorises them by EU policy area. Topic galleries allow for
easy browsing, and where policy areas overlap, for instance between environment
and social policies, links are provided to the graphics in the associated area.
EPRS
creates the visuals based on statistical information from sources mentioned on
the graphic. The type of information varies widely: from the full and complex
picture on EU-US trade
in a single handy picture, (including the thorny subject of rights management
in the form of royalties and licence fees); to a simple bar chart on EU assistance
requested in response to disasters, such as the ever-more
frequent cases of flooding; to a table demonstrating the significant rise in net adjustments
to national contributions to the EU budget last year, where nine
Member States were required to pay more, and a further 19 received a
reimbursement.
Whether
illustrating an argument using a complex graph on household use of
energy by source in 2013, and 2003-13 change, a simple bar chart
showing the number of Syrian
refugees in neighbouring countries, or the number unemployed in
the EU28, or a simple pie chart on freight
transport performance by mode; we provide a short description of
the topic with each graphic, which is useful when sharing on social media. A
link is also available to the bigger picture, in the form of the publication
where the graphic first appeared.
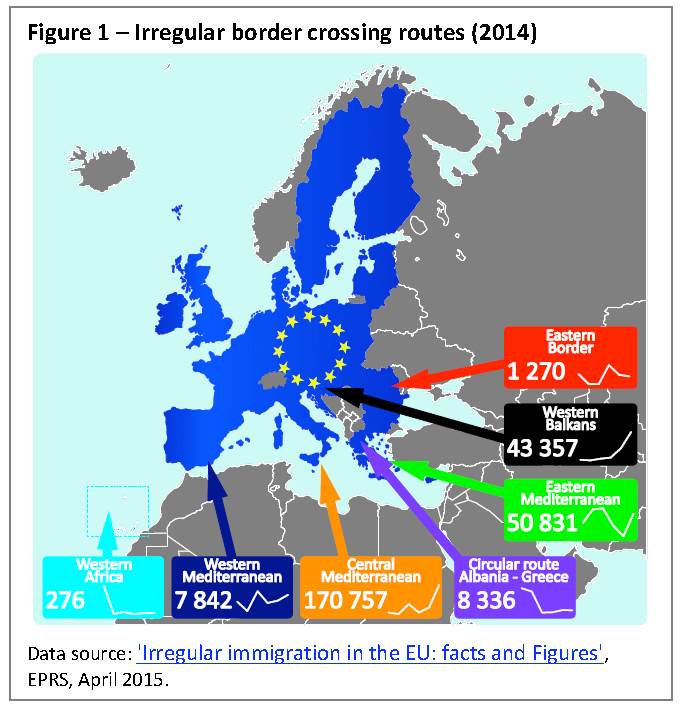
Handy
maps with statistical data are also available, such as an EU map of average
farm size, from very big to very small, per region; or the
much-viewed-on-Twitter map of routes of irregular
migration into the EU in 2014. A map of the cost
of non-Europe shows the potential gains for EU GDP which could
be achieved with a full phasing-in of proposed reforms over several years, such
as for instance, banking union to guard against further financial crises.
All the visuals are available to download and reuse for any purpose on any media. The only proviso being that we require citation as an author (credit: European Parliamentary Research Service).